Annual Report 2017
Financial Highlights
Total Income
Total income showed strong momentum and rose 10% to $8.85 billion, led by new highs in both net interest income and fee and commission income.
Net interest income rose 11% to $5.53 billion from a year ago on the back of higher net interest margin and healthy loan growth of 5%. Net interest margin increased 6 basis points to 1.77%, mainly attributed to higher yields from interbank balances and securities, a function of both our measured efforts in deploying excess funds into higher-yielding assets and a rising interest rate environment.
Non-interest income increased 8% to $3.32 billion. Fee and commission income registered a robust growth of 12% to $2.16 billion, driven by strong performances in wealth management, fund management and credit card businesses. Higher net gains from the disposal of investment securities also contributed to the increase in other non-interest income to $1.16 billion.
$8,851
million
+ 10%
Net Profit After Tax
The Group reported net earnings of $3.39 billion for the full year of 2017, 9% higher than a year ago.
$3,390
million
+ 9%
Customer Loans/Deposits
Net customer loans grew 5% from a year ago to $232 billion in 2017. The growth was broad-based across most territories and industries.
Customer deposits grew 7% to $273 billion, led by growth in US dollar deposits.
The Group’s funding position continues to be strong with a healthy loan-to-deposit ratio at 85.1% in 2017.
Note: Net customer loans were net of total allowance.
Net Customer Loans
$232
billion
+ 5%
Customer Deposits
$273
billion
+ 7%
Loan/Deposit ratio
85.1
%
- 1.7% pt
Shareholders’ Equity/Return on Equity
Shareholders’ equity increased 12% from a year ago to $36.9 billion as at 31 December 2017, due to higher retained earnings, issuance of US$650 million perpetual capital securities and shareholders’ participation in the scrip dividend scheme.
Return on equity remained at 10.2% for 2017.
Shareholders’ Equity
$36.9
billion
+ 12%
Return on Equity
10.2
%
0.0% pt
Total Assets/Return on Assets
The Group’s total assets grew 5% to $359 billion in 2017 mainly on higher loan volume.
Return on assets for 2017 increased to 0.98%.
Total Assets
$359
billion
+ 5%
Return on Assets
0.98
%
+ 0.03% pt
Capital Adequacy Ratio (CAR)
As at 31 December 2017, the Group’s strong capital position remained well above the MAS minimum requirements with Common Equity Tier 1 and Total CAR at 15.1% and 18.7% respectively. The Group’s leverage ratio stood at 8.0% as at 31 December 2017, above the minimum requirement of 3%.
CET1 CAR
15.1
%
+ 2.1% pt
Total CAR
18.7
%
+ 2.5% pt
Loans By Geography
Gross loans grew 5% year-on-year to $236 billion as at 31 December 2017.
Singapore, which accounted for 54% of the Group loan base, reported 2% growth year-on-year to reach $128 billion while regional countries contributed a strong growth of 9%.
Note: Loans by geography are classified according to where credit risks reside, largely represented by the borrower’s country of incorporation/operation
(for non-individuals) and residence (for individuals).
(for non-individuals) and residence (for individuals).
$236
billion
+ 5%
Overseas Profit Before Tax Contribution
The Group’s net profit before tax was 11% higher at $4.21 billion.
Overseas profit contribution was higher at 40.8% in 2017 compared with 37.4% a year ago.
40.8
%
+ 3.4% pt
Five-Year Group Financial Summary
2013
2014
2015
2016
2017
Selected Income Statement Items ($ million)
Total income
6,720
7,457
8,048
8,061
8,851
Total expenses
2,898
3,146
3,597
3,696
4,027
Operating profit
3,822
4,311
4,451
4,365
4,824
Net profit after tax ¹
3,008
3,249
3,209
3,096
3,390
Selected Balance Sheet Items ($ million)
Net customer loans
178,857
195,903
203,611
221,734
232,212
Customer deposits
214,548
233,750
240,524
255,314
272,765
Total assets
284,229
306,736
316,011
340,028
358,592
Shareholders’ equity ¹
26,388
29,569
30,768
32,873
36,850
Financial Indicators (%)
Expense/Income ratio
43.1
42.2
44.7
45.9
45.5
Non-performing loans ratio
1.1
1.2
1.4
1.5
1.8
Return on average ordinary shareholders’ equity
12.3
12.3
11.0
10.2
10.2
Return on average total assets
1.12
1.10
1.03
0.95
0.98
Return on average risk-weighted assets
1.97
1.94
1.74
1.51
1.63
Capital adequacy ratios
Common Equity Tier 1
13.2
13.9
13.0
13.0
15.1
Tier 1
13.2
13.9
13.0
13.1
16.2
Total
16.6
16.9
15.6
16.2
18.7
Per ordinary share
Basic earnings ($)
1.84
1.98
1.94
1.86
1.99
Net asset value ($)
15.36
17.09
17.84
18.82
20.37
Net dividend (cents) ²
75
75
90
70
100
Dividend cover (times) ²
2.54
2.70
2.22
2.73
2.04
1
Relates to the amount attributable to equity holders of the Bank.
2
Included a special dividend of 5 cents in 2013 and 2014 respectively and 20 cents in 2017. 2015 included UOB’s 80ᵗʰ Anniversary dividend of 20 cents.
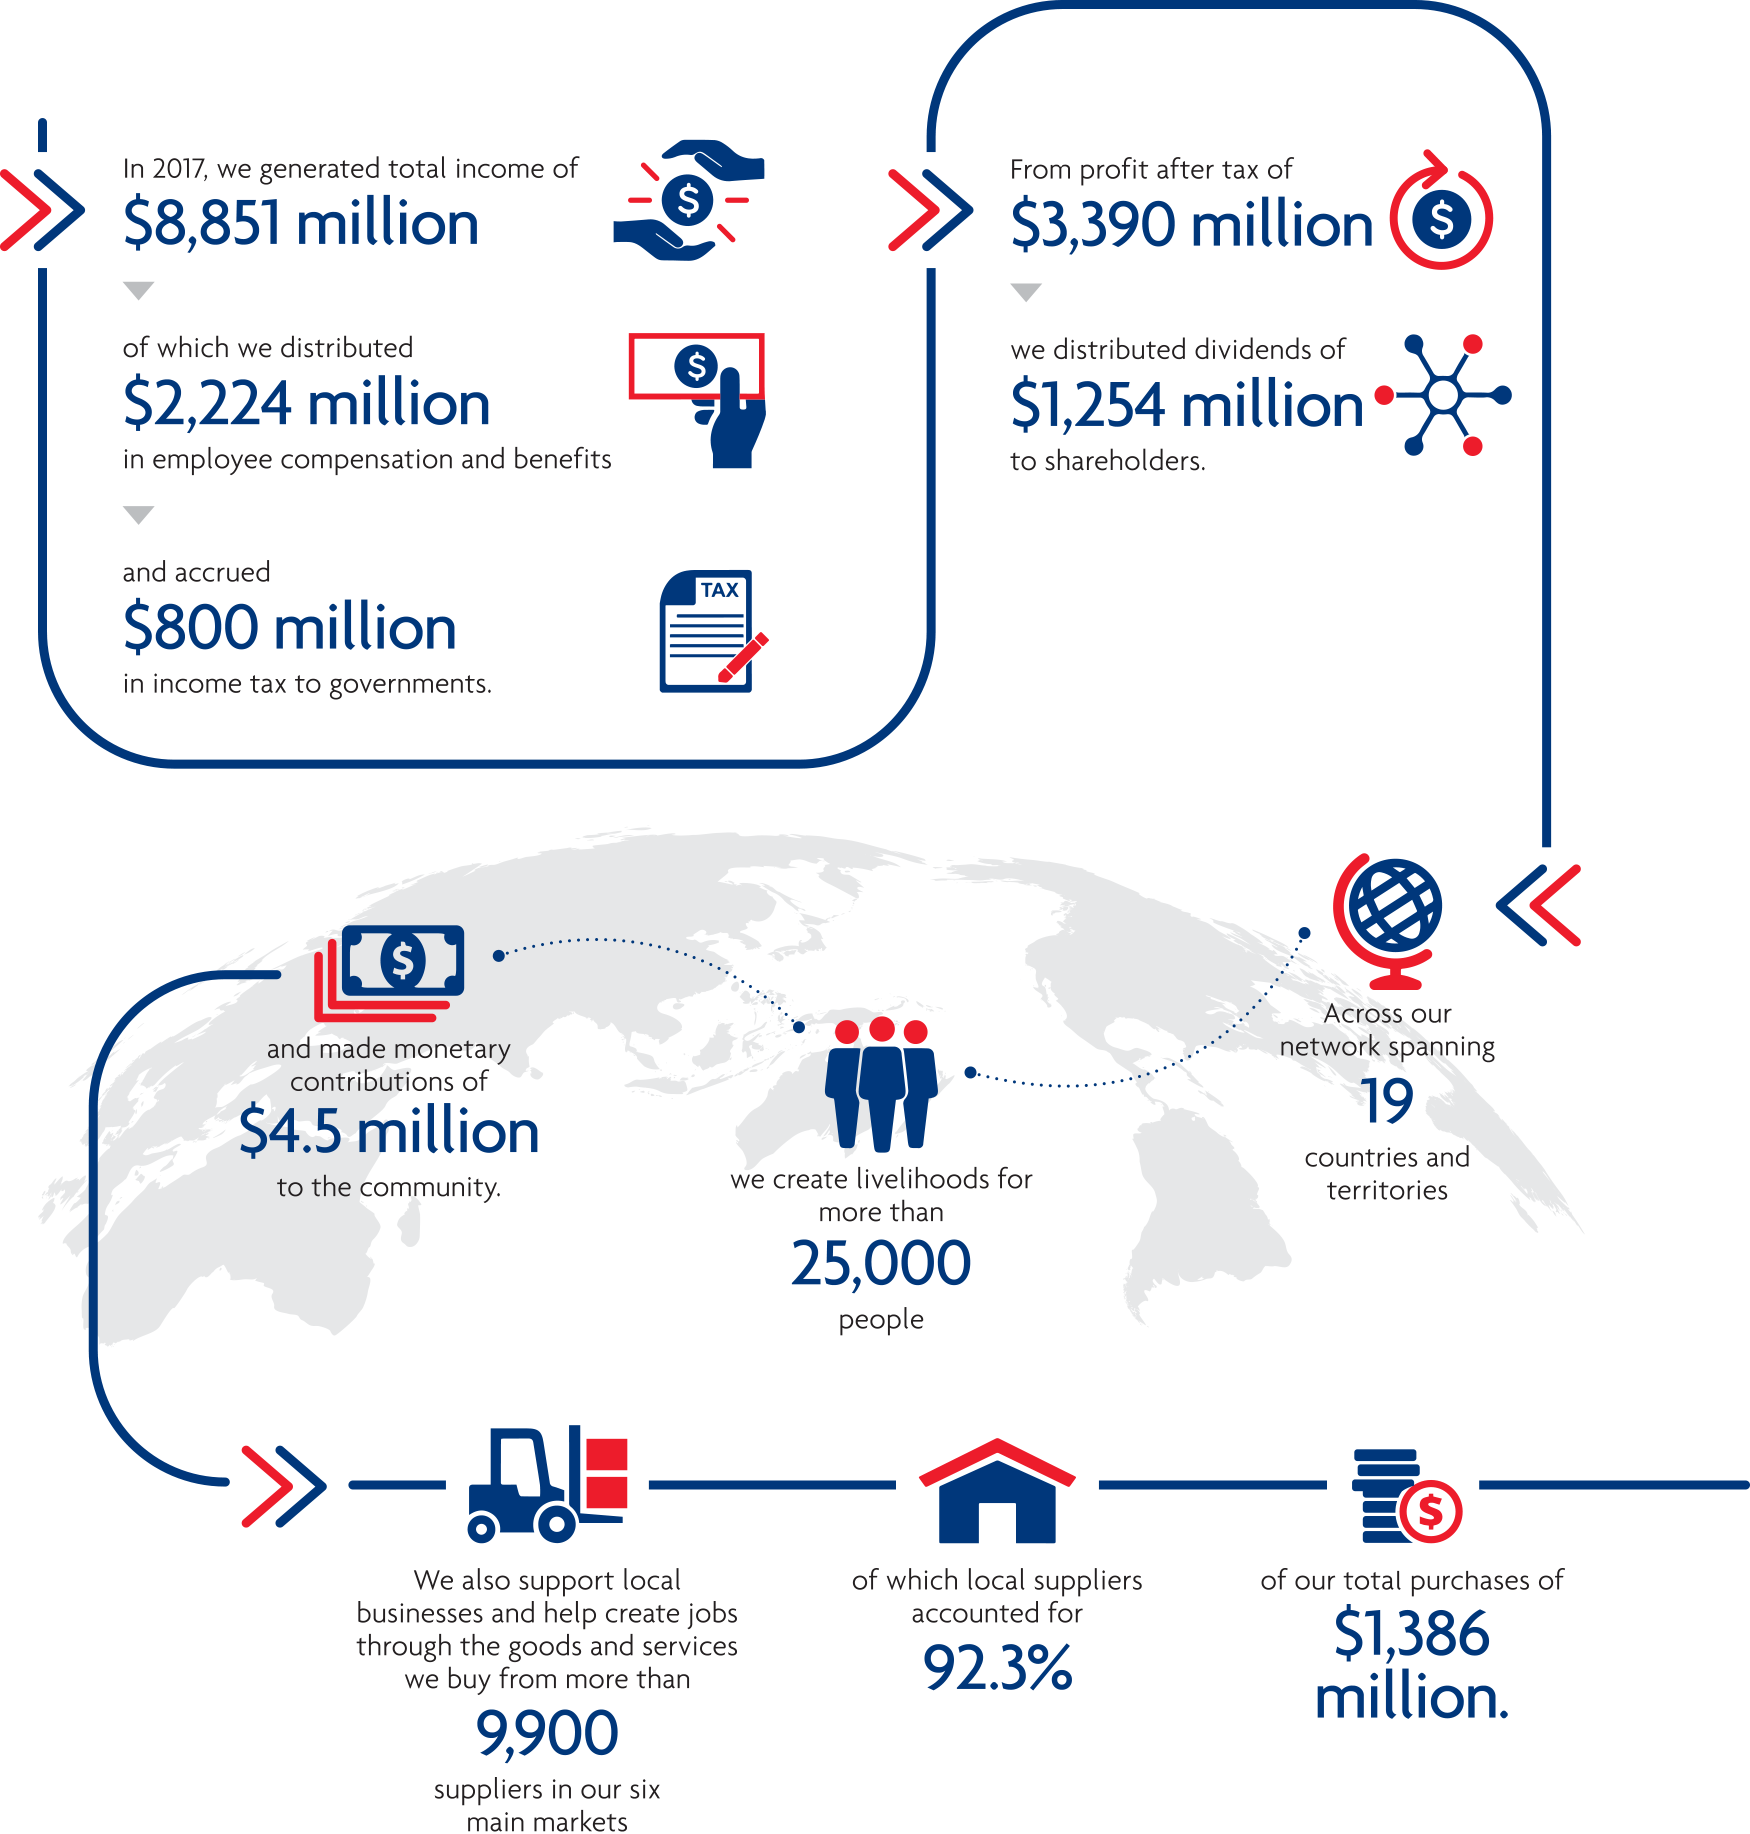
Economic Value of Our Contributions
In the course of conducting our business, we create direct and indirect economic value for our stakeholders and contribute to the development of local economies.