Financial Highlights
Stable core earnings in a slowing operating environment.
Total Income
income
($ million)
income
($ million)
income/Total
income (%)
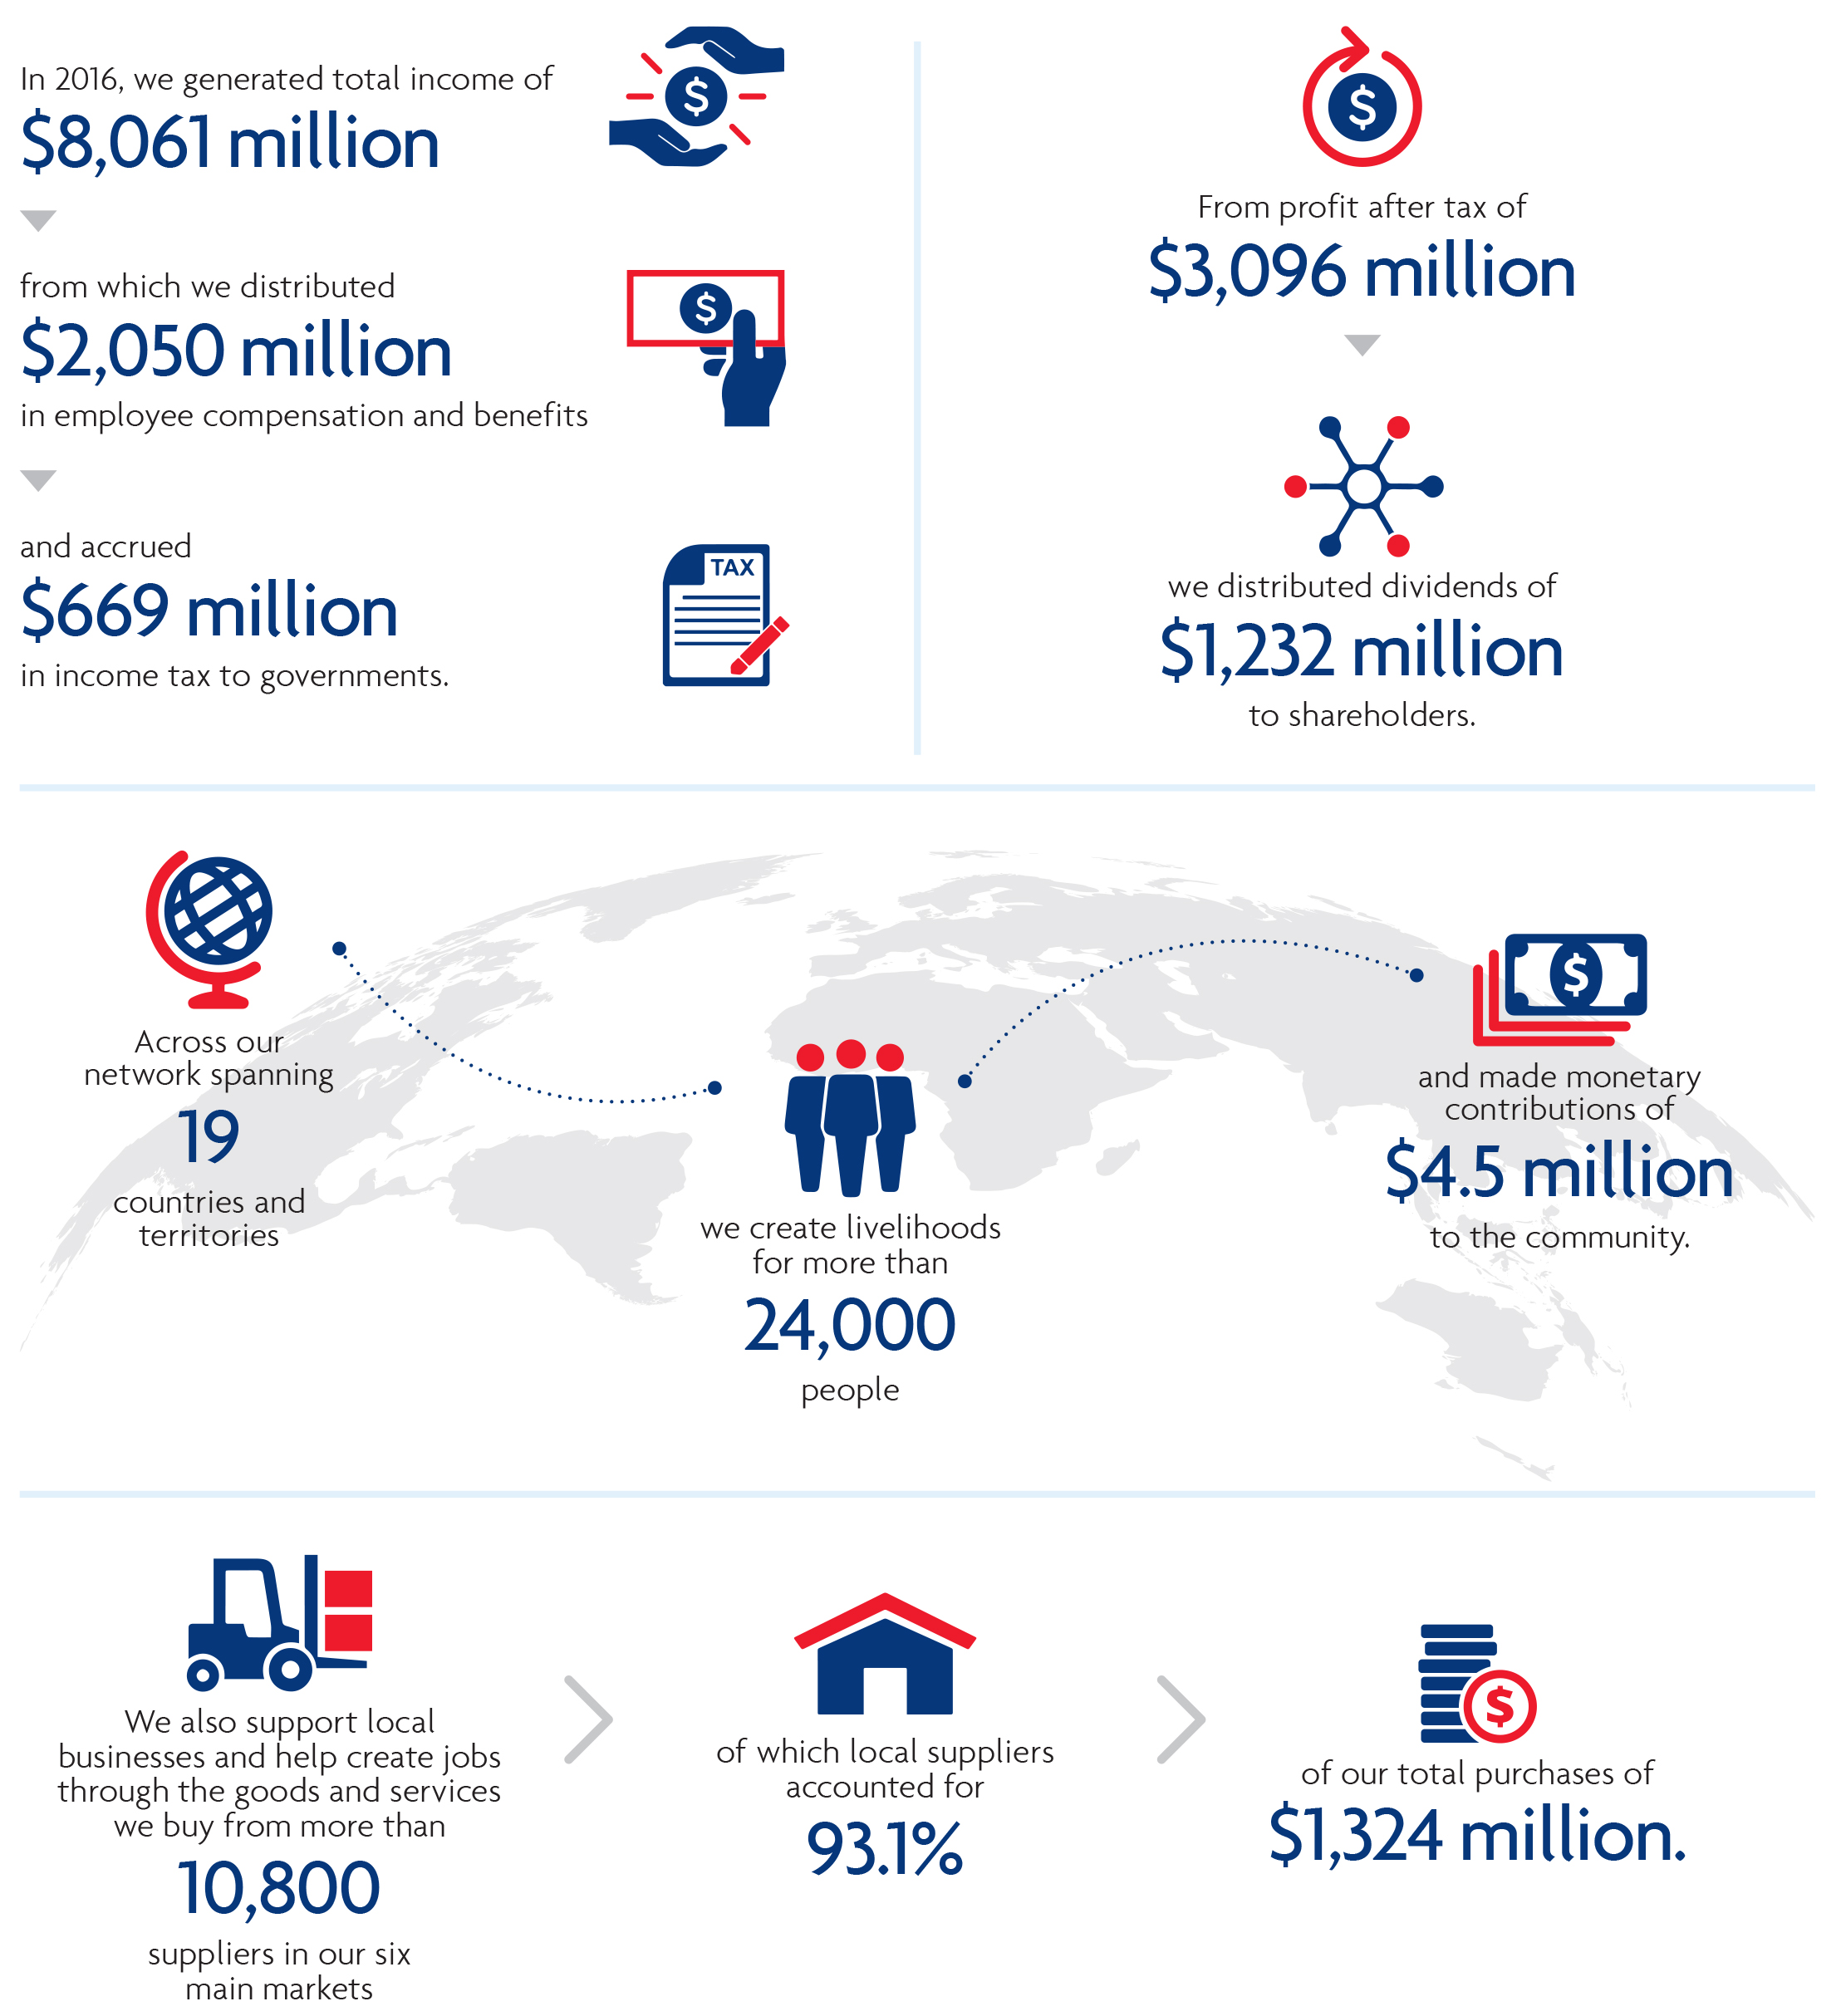
Total income was stable at $8.06 billion, reflecting the resilience of the Group’s core businesses in a slowing economic environment.
Net interest income increased 1.3% to $4.99 billion, led by healthy loan growth in the consumer and non-bank financial institution customer segments. Net interest margin decreased 6 basis points to 1.71%.
Non-interest income declined 1.6% to $3.07 billion. Trading and investment income fell 8.1% to $877 million due to lower gains from sale of investment securities, partially offset by higher trading income. Fee and commission income increased 2.5% to $1.93 billion, driven by higher credit card and fund management fees.
$8,061 million +0.2%
Net Profit After Tax
The Group reported net earnings of $3.10 billion for the full year of 2016, 3.5% lower than a year ago.
$3,096 million -3.5%
Customer Loans / Deposits
($ billion)
($ billion)
ratio (%)
Net customer loans grew 8.9% from a year ago to $222 billion in 2016.
Customer deposits grew 6.1% to $255 billion, mainly led by growth in Singapore dollar and US dollar deposits.
The Group's funding position continues to be strong with loan-to-deposit ratio at 86.8% in 2016.
Note: Net loans were net of total allowances. From 2013, customer deposits include deposits from financial institutions relating to fund management and operating accounts. Previously, these deposits were classified as “Deposits and balances of banks”.Customer Loans $222 billion +8.9%
Customer Deposits $255 billion +6.1%
Loan / Deposit Ratio 86.8% +2.1% pt
Shareholders' Equity/Return on Equity
Shareholders' equity increased 6.8% from a year ago to $32.9 billion as at 31 December 2016, due to retained earnings and strong shareholder take-up from the scrip dividend scheme.
Return on equity was 10.2% for 2016.
Shareholders' Equity $33 billion +6.8%
Return on Equity 10.2% -0.8% pt
Total Assets/Return on Assets
($ billion)
(%)
The Group's total assets grew 7.6% to $340 billion in 2016 mainly on higher loan volume.
Return on assets for 2016 was 0.95%.
Total Assets $340 billion +7.6%
Return on Assets
0.95% -0.08% ptCapital Adequacy Ratio (CAR)
(%)
(%)
As at 31 December 2016, the Group's strong capital position remained well above the MAS minimum requirements with Common Equity Tier 1 and Total CAR at 13.0% and 16.2% respectively. The Group's leverage ratio stood at 7.4% as at 31 December 2016, above the minimum requirement of 3%.
Note: With effect from January 2013, the Group adopted the Basel III framework for its CAR computation in accordance with the revised MAS Notice 637 and CET1 is mandated under MAS Notice 637.CET1 CAR
13.0% 0.0% ptTotal CAR
16.2% +0.6% ptLoans By Geography
- Singapore 125.5
- Malaysia 25.8
- Thailand 13.2
- Indonesia 11.9
- Greater China 27.2
- Others 22.1
Gross loans grew 8.8% year-on-year to $226 billion as at 31 December 2016.
Singapore, which accounted for 56% of Group loan base, registered 8.1% growth year-on-year to reach $126 billion while loans outside Singapore grew 9.7%.
Note: Loans by geography are classified according to where credit risks reside, largely represented by the borrower's country of incorporation/operation (for non-individuals) and residence (for individuals).Overseas Profit Before Tax Contribution
- Singapore 62.6%
- Malaysia 14.5%
- Thailand 5.1%
- Indonesia 1.9%
- Greater China 7.9%
- Others 8.0%
The Group’s net profit before tax was 2.4% lower at $3.78 billion.
Overseas profit contribution was lower at 37.4% in 2016 when compared with 38.9% a year ago.
37.4% -1.5% pt
Five-Year Group Financial Summary
Five-Year Group Financial Summary |
2012 | 2013 | 2014 | 2015 | 2016 |
|---|---|---|---|---|---|
|
Selected Income Statement Items ($ million)
Selected Income Statement Items($ million)
|
|||||
| Total income | 6,495 | 6,720 | 7,457 | 8,048 | 8,061 |
| Total expenses | 2,747 | 2,898 | 3,146 | 3,597 | 3,696 |
| Operating profit | 3,748 | 3,822 | 4,311 | 4,451 | 4,365 |
| Net profit after tax1 | 2,803 | 3,008 | 3,249 | 3,209 | 3,096 |
| Selected Balance Sheet Items ($ million) | |||||
| Net customer loans | 152,930 | 178,857 | 195,903 | 203,611 | 221,734 |
| Customer deposits2 | 182,029 | 214,548 | 233,750 | 240,524 | 255,314 |
| Total assets | 252,900 | 284,229 | 306,736 | 316,011 | 340,028 |
| Shareholders’ equity1 | 25,080 | 26,388 | 29,569 | 30,768 | 32,873 |
| Financial Indicators (%) | |||||
| Expense / Income ratio | 42.3 | 43.1 | 42.2 | 44.7 | 45.9 |
| Non-performing loans ratio | 1.5 | 1.1 | 1.2 | 1.4 | 1.5 |
| Return on average total assets | 1.18 | 1.12 | 1.10 | 1.03 | 0.95 |
| Return on average ordinary shareholders' equity | 12.4 | 12.3 | 12.3 | 11.0 | 10.2 |
| Capital adequacy ratios3 | |||||
| Common Equity Tier 1 | 14.7 | 13.2 | 13.9 | 13.0 | 13.0 |
| Tier 1 | 14.7 | 13.2 | 13.9 | 13.0 | 13.1 |
| Total | 19.1 | 16.6 | 16.9 | 15.6 | 16.2 |
| Per ordinary share | |||||
| Basic earnings ($) | 1.72 | 1.84 | 1.98 | 1.94 | 1.86 |
| Net asset value ($) | 14.56 | 15.36 | 17.09 | 17.84 | 18.82 |
| Net dividend (cents)4 | 70 | 75 | 75 | 90 | 70 |
| Dividend cover (times)4 | 2.54 | 2.54 | 2.70 | 2.22 | 2.73 |
- Relates to the amount attributable to equity holders of the Bank.
- From 2013, customer deposits include deposits from financial institutions relating to fund management and operating accounts. Previously, these deposits were classified as “Deposits and balances of banks”.
- With effect from January 2013, the Group adopted the Basel III framework for its capital adequacy ratio computation in accordance with the revised MAS Notice 637 and Common Equity Tier 1 is mandated under MAS Notice 637.
- Included special dividend of 10 cents in 2012 and 5 cents in 2013 and 2014 respectively. 2015 included UOB’s 80th Anniversary dividend of 20 cents.
Economic Value Of Our Contributions
In the course of conducting our business, we create direct and indirect economic value for our stakeholders and contribute to the development of local economies.